Basic Statistics

Master the Fundamentals: Your Data Analysis Journey Starts Here
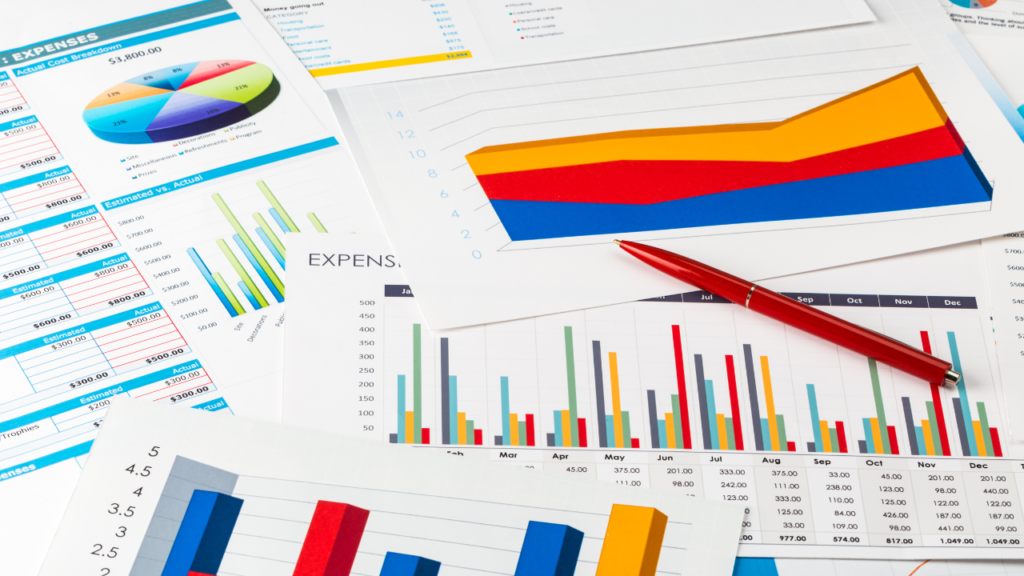
We dive deep into the basics of statistics, revisiting key concepts from your school days and expanding on them. You’ll gain a solid understanding of mean, median, mode, variance, standard deviation, and other essential tools for analyzing data and making informed decisions. Learn how to apply these concepts in real-life scenarios through hands-on exercises and projects.
Why it matters: Strong foundational knowledge in statistics is crucial for any data analyst. It empowers you to understand data patterns, draw meaningful conclusions, and communicate insights effectively.
Course Curriculum:
- Introduction to Statistics: What it is and its role in data analysis
- Measures of Central Tendency: Mean, median, mode, and their interpretations
- Measures of Variability: Variance, standard deviation, and understanding data spread
- Statistics with Python: Basic data analysis using Python libraries
- Probability and Distributions: Normal, binomial, Poisson, and Bernoulli distributions
- Hypothesis Testing and P-values: Drawing conclusions based on data evidence
- Correlation and Relationships: Understanding how variables relate to each other
Excel

Unleash the Power of Excel for Data Analysis
Excel is a powerful tool for data management and analysis. In this course, you’ll learn how to navigate its functionalities, manipulate data effectively, and create insightful visualizations. Master essential formulas, formatting techniques, and charting skills to transform raw data into clear and impactful presentations.
Why it matters: Excel is an industry-standard tool used by various professionals, including data analysts. Proficiency in Excel allows you to handle data with efficiency and accuracy, presenting findings in a visually appealing and informative way.
Course Curriculum:
- Introduction to Excel: Getting started with the interface and basic functionalities
- Data Import and Manipulation: Reading different data formats, cleaning, and organizing data
- Formula Basics: Understanding cell references, functions, and building formulas
- Formatting and Presentation: Enhancing data readability with formatting tools
- Excel Charts: Creating various chart types to visualize data trends and relationships
- Data Analysis with PivotTables: Summarizing and analyzing large datasets efficiently
Power BI

Craft Interactive Dashboards and Reports with Power BI
Take your data visualization to the next level with Power BI. Learn how to connect to various data sources, build data models, and create interactive dashboards and reports. Explore powerful DAX functions for calculations and leverage AI features for enhanced insights.
Why it matters: Power BI is a game-changer in data storytelling. It allows you to create dynamic and visually engaging reports that effectively communicate complex data insights to stakeholders. This skill is highly sought after in the data analysis field.
Course Curriculum:
- Introduction to Power BI: Understanding its capabilities and applications
- Connecting and Shaping Data: Importing data from diverse sources and transforming it
- Building Data Models: Creating relationships between tables for accurate analysis
- DAX Functions and Measures: Performing calculations and creating custom metrics
- Data Visualization and Reporting: Designing interactive dashboards and reports
- Advanced Techniques: Exploring AI features and best practices for effective communication
SQL

Unlock the Power of Databases with SQL
Dive into the world of SQL, the language for interacting with relational databases. Learn how to create, manipulate, and query data stored in databases, gaining valuable insights for informed decision-making. Understand essential CRUD operations, joins, and functions to extract meaningful information.
Why it matters: SQL is essential for working with large datasets stored in databases, which are prevalent in various industries. This skill empowers you to retrieve specific data, analyze it, and gain valuable insights that would be difficult or impossible to extract manually.
Course Curriculum:
- Introduction to SQL: Understanding its purpose and basic structure
- Creating and Managing Tables: Defining table structures and manipulating data
- CRUD Operations: Performing data insertion, retrieval, updates, and deletions
- SQL Functions: Utilizing built-in functions for calculations and data manipulation
- Select Queries: Crafting queries to retrieve specific data based on conditions
- Joins: Combining data from multiple tables for comprehensive analysis
- Advanced Techniques: Exploring subqueries, unions, and stored procedures
Capstone Project

Apply your acquired skills in a real-world project. Design a database for a social network, integrating your knowledge of SQL, data modeling, and analysis.
Additional Services

- Resume Review & Interview Prep: Get personalized feedback and guidance to land your dream data analyst role.
- LinkedIn Optimization: Make your profile shine and attract recruiters with expert optimization strategies.
- On-the-Job Support: Get ongoing support from experienced coaches as you navigate real-world data challenges.
Enroll today and embark on your exciting journey to becoming a data analyst!
